
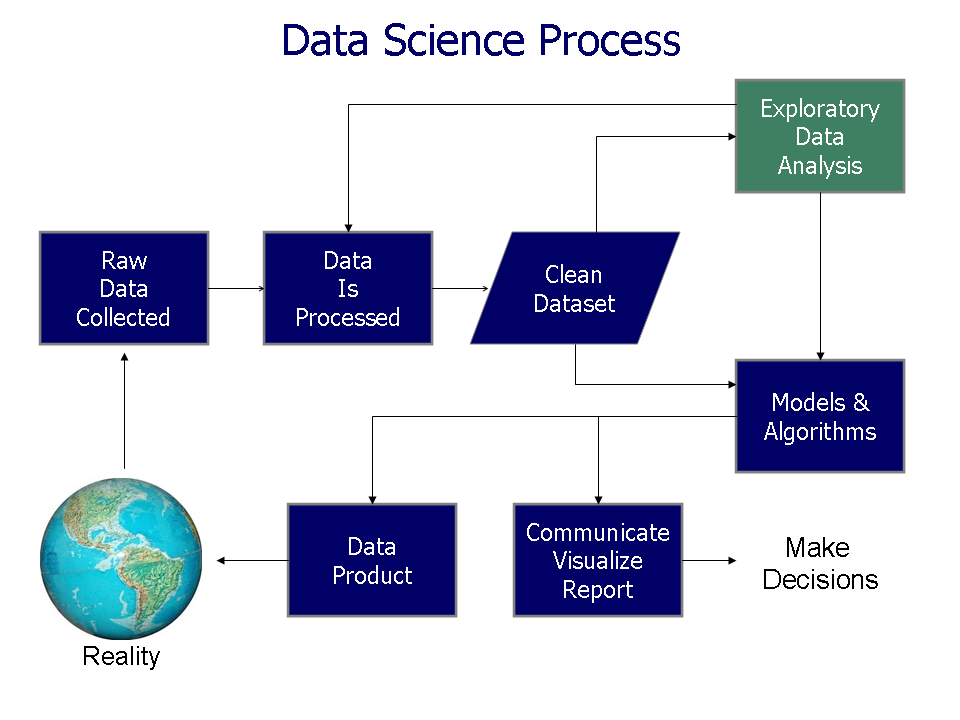
[Data Visualization] Exploratory data analysis
Exploratory data analysis(EDA)
In statistics, exploratory data analysis (EDA) is an approach to analyzing data sets to summarize their main characteristics, often with visual methods.
The objectives of EDA are to:
Suggest hypotheses about the causes of observed phenomena
Assess assumptions on which statistical inference will be based
Support the selection of appropriate statistical tools and techniques
Provide a basis for further data collection through surveys or experiments
Typical graphical techniques used in EDA are:
refer to https://en.wikipedia.org/wiki/Exploratory_data_analysis
Box plot
Histogram
Multi-vari chart
Run chart
Pareto chart
Scatter plot
Stem-and-leaf plot
Parallel coordinates
Odds ratio
Targeted projection pursuit
Glyph-based visualization methods such as PhenoPlot and Chernoff faces
Dimensionality reduction:
Multidimensional scaling
Principal component analysis (PCA)
Multilinear PCA
Nonlinear dimensionality reduction (NLDR)
Projection methods such as grand tour, guided tour and manual tour
Interactive versions of these plots